The Spectrum Strategy: A Framework for Dynamic Management
In a world saturated with monochromatic data dashboards and gray-toned strategic plans, a powerful, often overlooked principle emerges: color is not just an aesthetic choice, it is a cognitive and organizational tool. The Spectrum Strategy is a management and research concept that leverages the inherent properties of color—its ability to categorize, prioritize, evoke emotion, and create visual hierarchy—to transform complex information into clear, actionable insight. It moves beyond simple decoration, proposing that a deliberate, colorful framework can fundamentally enhance understanding, communication, and decision-making.
Beyond Decoration: The Functional Power of Color
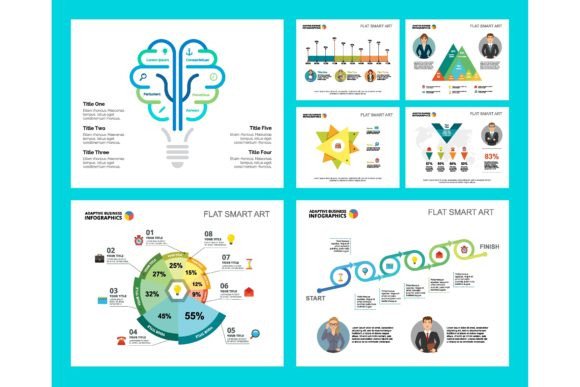
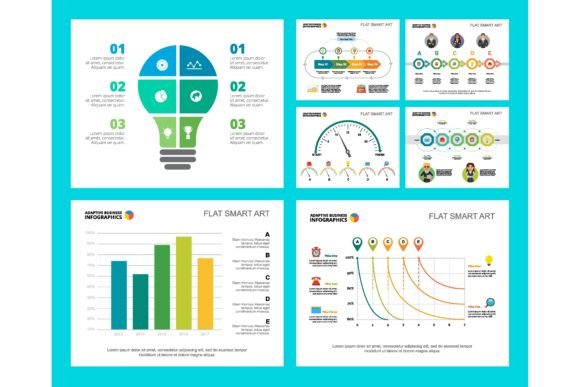
What makes the Spectrum Strategy genuinely useful is its grounding in practical human psychology. Our brains process color faster than text or shape. It triggers immediate associations and can be used to establish intuitive systems. In management, this translates to using distinct colors to represent different departments, project phases, risk levels, or performance metrics. In research, a colorful chart set can visually separate data clusters, highlight correlations, or indicate trends over time far more effectively than a single-hue graph. The concept isn't about making things "pretty"; it's about using a spectrum to create a universal, at-a-glance language for your team or your audience.
Creative Applications and Project Ideas
The applications of this colorful concept are vast, stretching across the typical boundaries of reports and slides. Consider these actionable ideas:
- Financial Reports Reimagined: Instead of a table of black-and-white numbers, use a consistent color code: green for growth metrics, blue for stable assets, amber for cautious watchpoints, and red for critical alerts. A stakeholder can immediately grasp the financial health without delving into every figure.
- Dynamic Workflow Layouts: Map your process using a color progression. Start with cool blues for "Initiation" phases, move to energetic yellows for "Active Development," and transition to grounded greens for "Review & Completion." This creates a visual journey that team members can intuitively follow, identifying their current stage and the next.
- Engaging Brochure Design: For a service brochure, assign each core service or customer benefit a unique color. Use these colors consistently across icons, headers, and call-out boxes. This not only breaks up text-heavy layouts but also helps potential clients mentally categorize and recall your offerings.
- Presentation Slide Templates: Build a template where the color of the slide border or background denotes the type of content: white for factual data, a soft blue for case studies, a warm orange for problem statements, and a deep purple for strategic conclusions. This guides your audience through the narrative structure of your presentation.
Adapting the Spectrum for Different Audiences and Goals
A key strength of this approach is its adaptability. The same principle can be tailored to vastly different contexts and user needs.
For educators and trainers, a colorful research infographic can differentiate between theoretical concepts, practical examples, and assessment criteria, aiding student comprehension. A marketer might use a spectrum to visually segment a target audience map, with colors representing different demographic clusters or customer journey stages. Entrepreneurs and small business owners can apply it to a simple business plan, using color to starkly separate their operational, financial, and marketing strategies, making the plan easier to navigate and update.
The interpretation can also vary in style. A minimalist approach might use subtle tints and shades of a single base color to show gradients of priority. A bold, high-contrast style could employ vivid, distinct colors to represent completely independent silos of information. The choice depends on the message: gradients suggest continuity and relationship, while contrast emphasizes separation and distinction.
Keeping Results Clear and Effective
While the creative possibilities are exciting, the practical guidance is crucial. To ensure your colorful framework remains an effective tool and not a confusing distraction, follow these core recommendations:
- Establish a Legend: Always define your color system upfront, in a legend or key. This is the rulebook for your visual language.
- Limit Your Palette: Use a manageable number of colors—typically 4 to 6 main hues. Too many colors revert to visual chaos.
- Consistency is King: Once assigned, a color must represent the same element across all pages, slides, or charts. Inconsistency breaks the cognitive link.
- Consider Accessibility: Ensure sufficient contrast for readability and be mindful that color associations can vary culturally. Pair colors with text labels for clarity.
- Align Color with Meaning: Leverage natural associations (e.g., red for stop/attention, green for go/growth) where helpful, but don't rely on them exclusively if your internal system differs.
A Tool for Unified Vision and Original Communication
Ultimately, the Spectrum Strategy serves two profound purposes. First, it fosters a unified vision. When a team adopts a shared color-coded system for a project, everyone interprets the status, risks, and priorities through the same lens, reducing miscommunication. Second, it enables original and audience-friendly communication. In a sea of generic templates, a thoughtfully colored financial report, workflow, or brochure stands out. It signals care, clarity, and a modern approach to information design.
For the creator, designer, or manager looking for inspiration, this concept offers a path away from generic, text-heavy documents. It invites you to think structurally about visual language. Start by asking: "What are the core categories, phases, or levels in this project?" Assign each a color. Then, build your charts, slides, and layouts around that spectrum. You'll find that color, used with strategic intent, is not just an element of design, but a foundational component of clear thinking and effective communication.