Colorful Consulting: The Strategic Art of Visual Communication
In a world saturated with information and data, clarity is currency. For consultants, marketers, and business leaders, the challenge is not just having valuable insights, but making them understood, remembered, and acted upon. This is where the concept of Colorful Consulting comes into play. It’s more than just making presentations look pretty; it’s a strategic methodology that leverages color psychology, visual hierarchy, and intuitive design to transform complex concepts into compelling, actionable narratives.
Beyond Decoration: The Purpose and Significance of Visual Strategy
The core purpose of Colorful Consulting is cognitive efficiency. Our brains process visual information 60,000 times faster than text. A well-designed infographic or presentation slide can convey the relationships in a financial report, the stages of a workflow, or the value propositions in a brochure far more effectively than a dense paragraph. Colorful Consulting recognizes that every chart, palette choice, and layout is a tool for communication, each with a specific job to do.
This approach holds immense significance in modern business. It bridges the gap between data analysts and decision-makers, between strategists and frontline teams. In an environment where attention is fragmented and time is scarce, a colorful, well-structured visual can cut through the noise. It ensures that key messages—like a critical KPI trend or a new process step—are not just seen, but internalized.
The Psychology of the Palette: How Color Influences Understanding
At the heart of this concept is an understanding of color psychology. Color is not arbitrary within a consulting or marketing visual framework.
- Blue often evokes trust, stability, and logic, making it ideal for financial data and corporate branding elements.
- Green is associated with growth, sustainability, and positive progression, perfect for showcasing revenue trends or eco-friendly initiatives.
- Orange and Yellow attract attention and signal energy, innovation, or warnings, useful for highlighting key call-to-action buttons or urgent workflow alerts.
- Red commands attention for critical data points, losses, or stop stages in a process.
A Colorful Consulting chart set uses this psychology deliberately. A financial report might use a consistent blue theme for baseline data, with strategic red or green accents to draw the eye specifically to variances or successes. This creates an intuitive understanding before the viewer even reads a single figure.
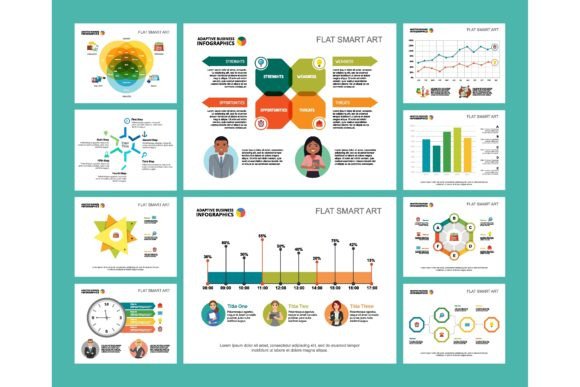
Building the Toolkit: Infographic Charts and Design Elements
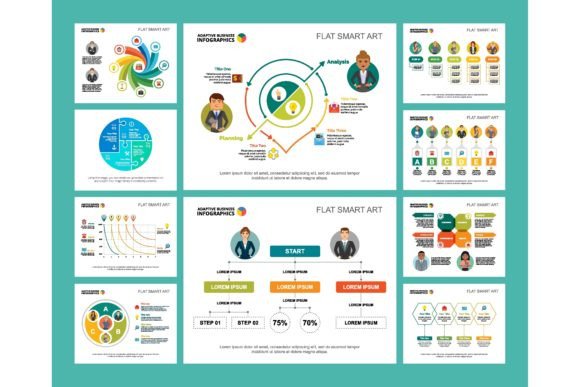
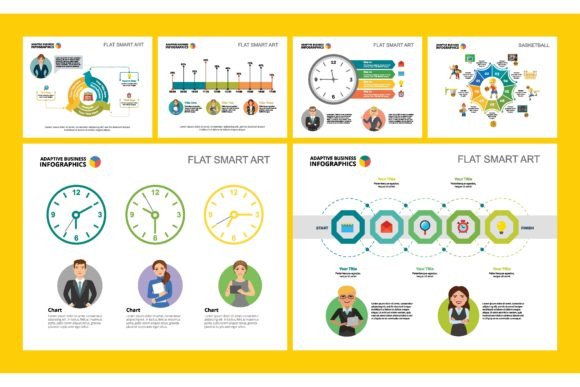
Practical application comes through a cohesive library of visual assets. A robust Colorful Consulting infographic charts set and accompanying business design elements serve as the foundational toolkit for creating clear communication.
These are not generic templates, but modular components designed for interoperability across different mediums:
- Financial Report Charts: Bar charts, line graphs, and pie charts designed with clear color-coding for revenue streams, expenses, and forecasts. Design elements include icon sets for "profit," "investment," and "risk," all using the established psychological palette.
- Workflow Layout Diagrams: Process flowcharts, Gantt charts, and swimlane diagrams where each stage or department is assigned a distinct color. This allows viewers to follow a process path intuitively. Elements like arrows, milestone markers, and decision diamonds are stylized for consistency.
- Brochure Design Modules: Hero section layouts, feature comparison tables, and testimonial blocks that use color to create visual zones. A brochure might use a warm color scheme for customer stories and a cool, factual scheme for technical specifications, guiding the reader's emotional journey.
These templates ensure that whether the audience is looking at a slide, a printed report, or a web page, the visual language is consistent, reinforcing brand identity and message clarity.
Clarifying Common Misunderstandings
A frequent assumption is that "colorful" means "busy" or "childish." This is a critical misunderstanding. Colorful Consulting is about strategic minimalism. It advocates using color with purpose, not abundance. The goal is to reduce cognitive load, not increase it. A slide with fifteen clashing colors is ineffective; a slide with three strategically chosen colors guiding the viewer's eye through a data story is powerful.
Another misconception is that this is solely a designer's responsibility. Colorful Consulting is a cross-disciplinary strategy. The consultant provides the insight, the analyst provides the clean data, and the visual strategy (guided by these principles and templates) ensures the insight is communicated. It requires collaboration from the outset of any project.
Practical Relevance in Modern Work and Daily Activities
The relevance of this visual communication concept extends far beyond formal consulting reports. Its principles are applicable in nearly any scenario where information needs to be conveyed clearly.
- Education & Training: Training manuals and educational materials using color-coded modules help learners retain information more effectively. A complex software tutorial can use a specific color for each step in the setup process.
- Technology & UX Design: App interfaces and dashboard designs are direct applications. User workflows, alert systems, and data visualizations within software rely on consistent color cues to guide user behavior and understanding.
- Daily Activities & Personal Productivity: Even personal to-do lists or project planners can benefit. Color-coding tasks by priority (red for urgent, blue for long-term) or category (green for financial, orange for creative) leverages the same brain mechanics for personal clarity.
By applying these principles, we move from simply sharing information to crafting understanding. This is the ultimate goal: to make the complex simple, the abstract tangible, and the important unmistakable.
Building a Broader Understanding: Colorful Consulting as a Communication Philosophy
Ultimately, Colorful Consulting is more than a set of templates; it’s a philosophy about humane communication in a data-driven age. It acknowledges that behind every spreadsheet number is a business outcome, behind every process step is a person's task, and behind every marketing statistic is a customer's need.
This philosophy fits into the larger movement towards visual thinking and design-centric problem-solving across industries. It aligns with the E-E-A-T (Experience, Expertise, Authoritativeness, Trustworthiness) principles of creating helpful content. By presenting information with expert, authoritative clarity and a trustworthy, consistent visual language, you build confidence and facilitate better decisions.
To implement this, start with intent. Before choosing a chart, ask: "What is the single most important thing my audience must understand?" Then, use your colorful toolkit—the psychology, the charts, the design elements—to make that one thing shine. Whether you're presenting a quarterly report, mapping a new workflow, or designing a brochure, let color be your strategic guide, not just your decoration. In doing so, you turn information into insight, and insight into action.